

Biotech pitch deck: structure, examples, and visualization tips

Share:

Copy link

Share via Telegram

Share on Facebook

Share on LinkedIn

Share via WhatsApp

Share on X

Share via Email
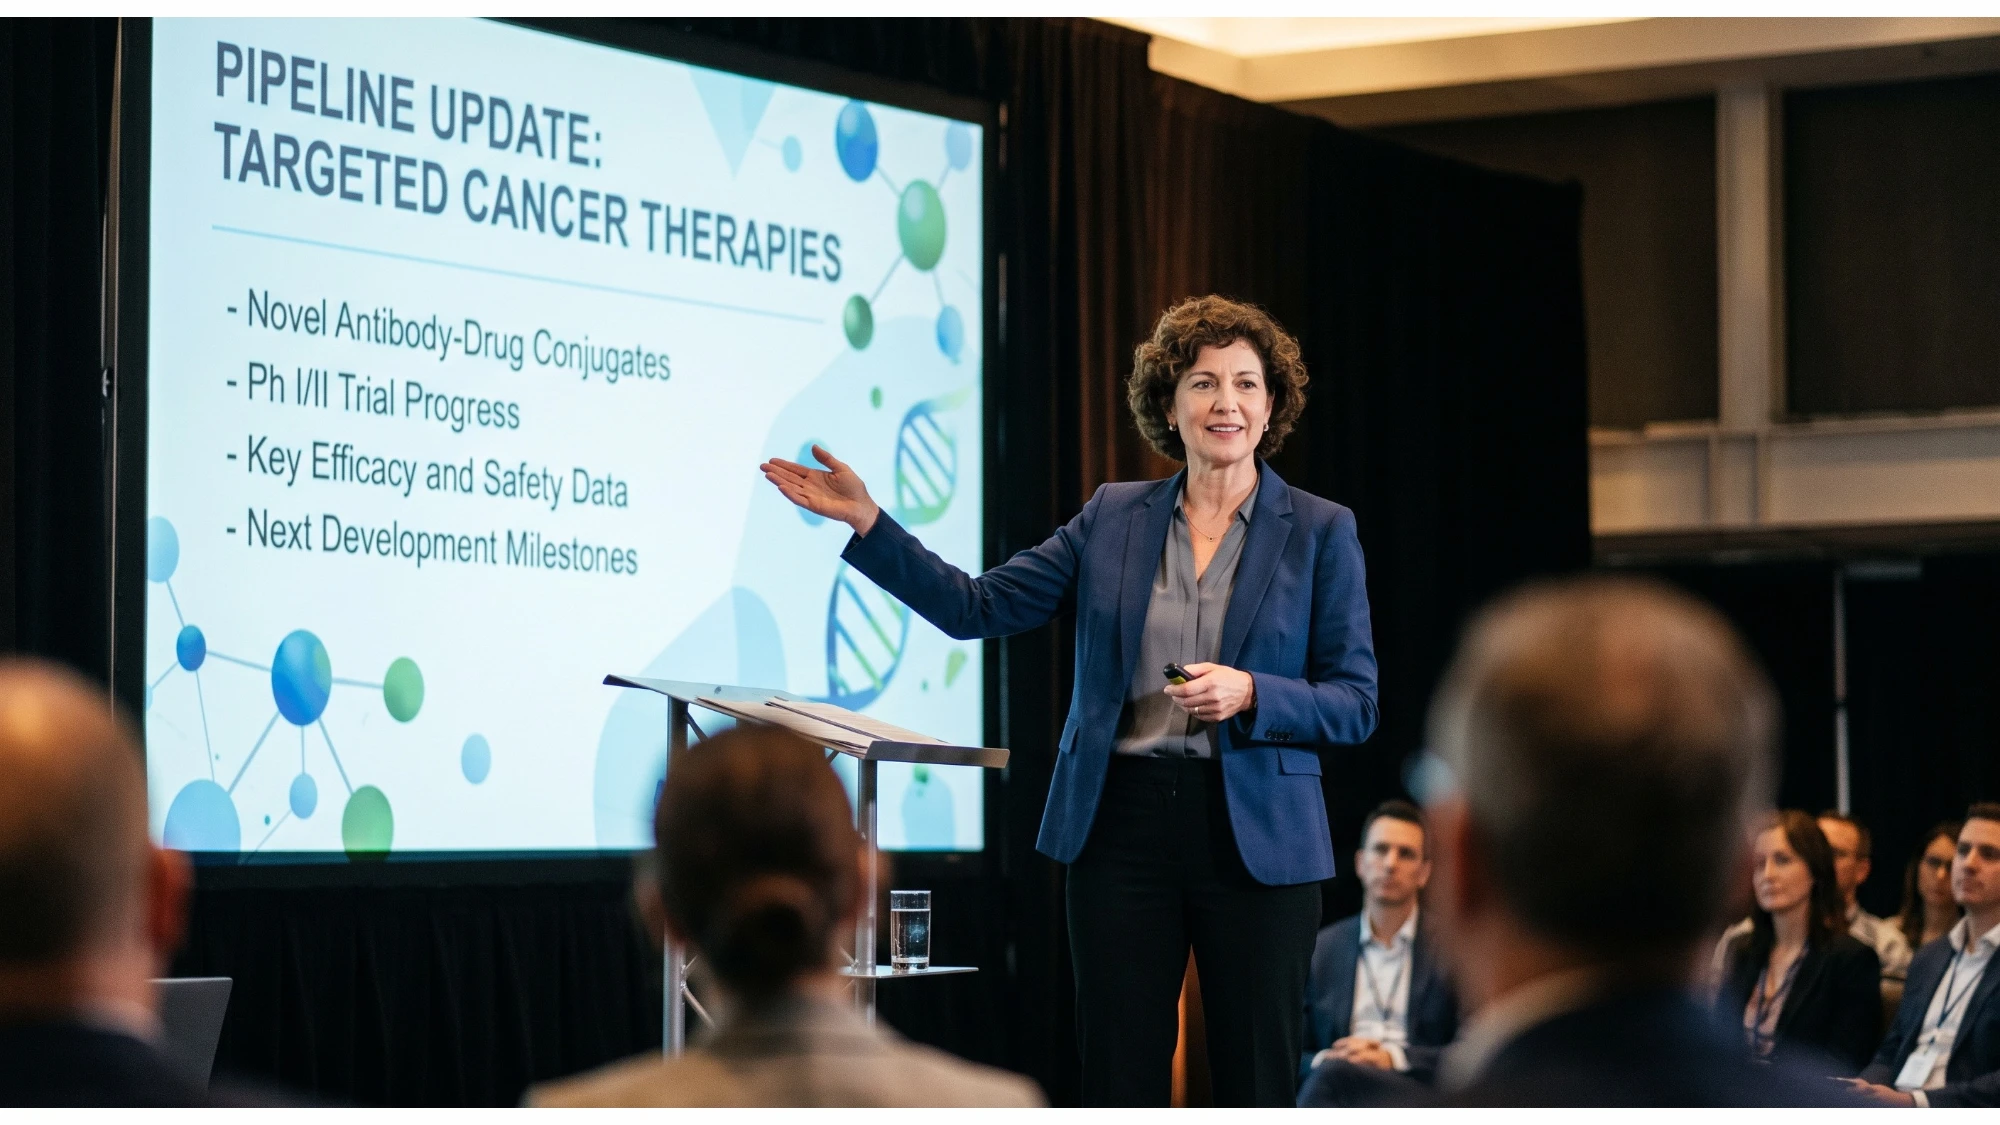
Table of contents
A biotech pitch deck is more complex than a typical startup deck. It must prove scientific credibility, make a commercial case, and show a clear plan to reduce risk without turning into a lab presentation. Investors need to trust the biology and see a path to a return, often in ten to fifteen minutes.
This article breaks the biotech pitch deck into its core parts, explains what each one needs to do, and covers the mistakes founders make. We'll also look at real, public biotech pitch deck examples to see what worked and what didn't. Whether you're building a biotech investor presentation for a seed round or a Series B, this guide gives you a structure to work from.
Key takeaways
1.
Every slide of the pitch deck should answer part of the same five questions: what's being developed, what evidence supports it, what's still unproven, how risk gets reduced, and what the money unlocks.
2.
Real examples show that investors forgive an honest gap in evidence at an early stage, but they never forgive a claim that isn't backed by anything shown in the deck.
3.
Visuals should make data easier to read. Charts and diagrams fit evidence slides. Animation only earns its place for a mechanism that's genuinely sequential. Additionally, the read-ahead version must work without it.
4.
The deck should be legible even without a presenter in the room. If a partner forwards it internally, the claims and evidence need to hold up on their own.
What biotech investors need to understand from your pitch deck
A biotech pitch deck should answer questions a generalist startup deck never has to. Here, investors consider not only the team and market. They must be confident in the science behind the project.
Therefore, every part of your deck should help answer the following questions:
-
What is being developed? (the actual technology or product – not just the vision or idea behind it)
-
What evidence supports it? (R&D data and real-world clinical evidence)
-
What remains unproven? (assumptions still waiting for R&D results)
-
How will the company reduce scientific, regulatory, and commercial risk? (a specific plan, adopted regulatory practices, and mitigation technologies)
-
What milestone will the requested capital unlock? (description of concrete next step)
These questions run through the entire deck, from your investment thesis to your funding. Keep them in mind as you build each section of your presentation below.
Biotech pitch deck structure: slide by slide
There's no single "correct" version of a biotech pitch deck. The exact slide count and depth depend on your funding stage, how “technical” your investors are, and whether the deck needs to work as a read-ahead PDF or only as a live presentation.
What matters is the job each slide has to do. Below is the core structure most biotech pitch deck slides follow. Each section includes the typical mistake and when a visual is actually worth the effort.
Investment thesis
Your investment thesis is the anchor slide for the whole deck. In two or three sentences, it should cover the following topics:
-
The company;
-
The core technology or asset;
-
The initial indication;
-
The development stage;
-
The investment opportunity.
Typical mistake. Writing a bold claim with no evidence behind it yet. Investors will look for proof later in the deck, and an unsupported thesis makes them read everything after it more skeptically. This slide rarely needs a visual beyond a clean, confident layout.
Unmet medical or scientific need
Name a specific clinical problem and describe its patient population, the current standard of care, and exactly where that standard falls short. "Large disease burden" isn't enough on its own — investors want the particular bottleneck your technology addresses. If a simple before-and-after comparison of patient outcomes helps understand the gap, a diagram works well here.
Typical mistake. Presenting a huge total target market number instead of a real gap in care. A big market doesn't prove there's an unmet need inside it.
Scientific solution and mechanism
Explain what the company is building, how the mechanism actually works, and why it addresses the problem you just described. This is usually the most technical part of the deck, and it's where investors decide whether the science is credible.
A pathway diagram, scientific illustration, or a short static sequence can carry most of the explanation. In a live pitch, a short mechanism of action animation can explain a dense mechanism in seconds. Just make sure the read-ahead version of the deck still makes sense without it.
Typical mistake. Over-explaining biology, using dense technical data and scientific jargon, at the expense of "why it matters."
Evidence and validation
Show your strongest preclinical, clinical, or technical findings, along with the context behind them. The context should explain:
-
What model was used;
-
What the data actually means;
-
What assumptions remain untested.
Visuals should help a reader interpret real data, not create an impression of more certainty than the study supports. For example, a bar chart, dose-response curve, or survival curve (Kaplan-Meier) communicate findings more directly than a decorative illustration.
A simple study-design diagram can show how an in vitro assay, animal model, or human trial was structured without extra text. Assumptions and limitations work best as a direct annotation on the chart itself.
Typical mistake. Mixing observed data with interpretations, assumptions, and further planning. All the data should be clearly separated, and the deck must avoid vague claims of "validation" without disclosed information.
Product, asset, platform, or pipeline
Make the project scope unmistakable. Depending on the company, the project may center on:
-
A single asset — one product built for one indication;
-
A pipeline — several programs, each at a different stage;
-
A platform — one technology capable of generating multiple assets or applications.
If you're a biotech platform, show exactly what's been validated across multiple assets or applications, and be sincere about what's still potential rather than proven.
A pipeline chart is the standard visual here. It contains programs listed, development stages (discovery, preclinical, Phase 1, Phase 2, Phase 3) as columns, with a bar for each program showing exactly how far it's progressed.
Typical mistake. Implying platform-wide validation when only one program actually has data behind it. One successful data point doesn't prove the technology is repeatable. It could just be a lucky case.
Development and regulatory roadmap
Development and regulatory issues are the parts that investors pay the most attention to. They want to see the overall progress, its challenges, and whether it will pass regulatory reviews.
In this section, you should describe the following matters:
-
Where the company is at the moment;
-
Next experiments and planned trials;
-
The regulatory steps that need to be taken;
-
Estimated timing for the whole project and for each stage;
-
Value-inflection milestones.
For each milestone, explain how it reduces scientific, regulatory, or commercial risks. Show what “success” looks like at each stage.
Typical mistake. Not telling which step is routine progress and which one actually changes the company's risk profile.
Competitive landscape and differentiation
Compare your company honestly. Look beyond other startups and include:
-
Approved therapies and pipeline assets from bigger enterprises;
-
Alternative modalities;
-
Current workflows.
Consider how biotech industry trends could reshape the competitive landscape before your product reaches the market. Investors already assume you'll pitch yourself as the best option. So show them how you understand the alternatives and competitors.
A positioning map can work well here.
Plot two axes that actually matter for your case, for example, development stage on one and mechanism differentiation on the other. Place approved therapies, competitors' pipeline assets, alternative modalities, and current workflows on the map as individual points. Your company is just one point among them, not the center of the picture.
A real position, even in a weak spot, says more than a table where you win every row. If you need to compare on more than two criteria, use a plain fact table instead, and don't be afraid to leave cells where you don't lead.
Typical mistake. Presenting the classic matrix where your company somehow wins on every aspect without evidence. It looks like marketing, not analysis, and experienced investors notice it immediately.
Market and commercialization path
Show a realistic initial market: who buys, who pays, and how you'll reach them — through a direct launch, a partnership, or licensing. This slide doesn't have to duplicate a market-sizing tutorial. Use just a few critical numbers with a clear go-to-market logic.
Typical mistake. Spending the whole slide on total addressable market (TAM), serviceable addressable market (SAM), and serviceable obtainable market (SOM) presentation without describing how the company captures any of it.
Intellectual property and defensibility
If you have any assets or intellectual property that are important to your business, state them clearly.
Depending on the asset, key elements of defensibility may include:
-
Patents. What the patent covers, its status, and expiration date.
-
Regulatory exclusivity. Orphan drug designation, data exclusivity, or other protection that exists independently of patents.
-
Trade secrets. Manufacturing processes, R&D data, or formulations that are never disclosed publicly.
-
Licenses. Who owns the technology, whether the license is exclusive, and what rights it covers.
-
Freedom to operate. Evidence or assessment showing whether commercialization could infringe third-party intellectual property rights.
If you don't have any of these yet, just say so.
Typical mistake. Making unsupported legal claims. You should provide only a factual summary of what protects your position.
Team and execution capability
Connect your team's experience to the specific scientific, clinical, regulatory, and commercial risks the company needs to manage. A logo slide with job titles tells investors nothing about whether this team can actually execute the plan in front of them.
One useful option is a risk-mitigation table. Here, you present the possible risk, the person responsible for its mitigation, and what has already been done. You can also skip the table and present photos. Whichever format you use, connect each team member to the part of the plan they are responsible for.
Typical mistake. Introducing the team members without any context or description of their input into the project.
Funding ask and milestone-based use of funds
This stage is the climax of the entire pitch deck and implies maximum clarity and impact. These are several things that you should consider:
-
Round size, runway, and allocation. How much money do you need? For how long will it be enough? What will you spend it on?
-
Milestones the invested capital unlocks. What will be achieved by the moment the money runs out? For example, completion of Phase I or II with safety readout received.
-
Milestones tied to each major spend. $1 million for PoC, $5 million for Phase II completion, and so on.
Also show what each major expense is expected to achieve and how it helps reduce key risks.
Typical mistake. Asking for capital without structured milestones and using vague, grand-vision language without any concrete steps and assessments.
Additional slides by biotech model
The structure above covers most biotech pitch decks, but a few extra slides matter depending on your business model:
Biotech pitch deck examples and key lessons
Studying real biotech startup pitch deck examples can be more useful than starting with a template. Below are three decks, and each of them illustrates a different lesson. None of them, however, is a slide-for-slide template to copy.
Pepper Bio
Pepper Bio used a 21-slide seed pitch deck to raise $6.5 million in 2023 for its AI-driven, transomic drug-discovery platform. It was designed to identify and develop therapies for diseases with major unmet need.
What was right
-
Clear problem framing. The deck identifies a specific scientific failure mode and uses that to motivate the company’s approach.
-
Differentiated technical thesis. It explains why the company’s platform is different: it aims to capture functional biology and causative interactions rather than only presence/absence signals.
-
Commercially relevant outputs. Slide 8 converts the science into buyer-relevant questions about target validity and drug specificity, which is easier for pharma audiences to evaluate.
-
Integration-oriented positioning. Slide 10 suggests the platform fits into existing pharma processes, reducing the sense that adoption requires a full workflow replacement.
What could be better
-
No traction evidence in the excerpt. The OCR excerpt shows a strong problem statement and workflow claims, but no visible clinical, product, or customer traction metrics to support them.
-
Broad claims without visible proof points. The deck asserts it can integrate across nearly the entire drug-development process. However, the excerpt doesn’t show validation data, benchmark performance, or named case studies.
-
Unclear initial wedge. The slide text highlights the problem in general terms, but it does not identify a single first indication, lead program, or beachhead market.
Ginkgo Bioworks
In 2021, Ginkgo Bioworks went public through a SPAC merger at a $15 billion valuation, pitching itself as a horizontal platform for programming cells. They claimed to produce the infrastructure for the whole bio-economy rather than a single product or therapy.
What was right
-
The company already had paying customers and real revenue. The company presented data on real, paying customers on the platform before the pitch.
-
A portfolio spread across industries. The company had 22 customers in 2020. These were businesses across pharma, agriculture, food, and industrial biotech, with spinouts like Joyn Bio and Motif FoodWorks. This data was visible proof that the platform was used across multiple industries and could support the creation of new ventures.
-
A business model with two distinct revenue layers. The pitch separated near-term foundry usage fees from long-term downstream value share — royalties and equity in what customers eventually commercialize. Therefore, they gave investors both a steady story and a bigger upside story.
What could be better
-
The biggest upside was still unproven. Downstream value share was explicitly immaterial in the company's own disclosed financials at the time. Investors were asked to buy into a future royalty stream that had generated very little revenue at the time.
-
A market-size claim standing in for a near-term forecast. The pitch pointed to a bioengineered products market exceeding $2 trillion within 20 years. This was only a theoretical number, spanning every industry Ginkgo could serve. It had no relation to the programs already underway.
-
Growth guidance that assumed today's programs would convert. Public materials pointed toward revenue crossing $1 billion by 2025, a target that depended on early-stage programs turning into large-scale commercial products. It was an assumption investors had to take on faith.
Additionally, the company’s presentation contains around 60 slides of dense scientific info. Some of the slides also contain large text abstracts, so it can be hard for the investors to follow the idea throughout the whole presentation.
Butterfly Network
In 2021, Butterfly Network went public through a $1.5 billion SPAC merger. It pitched a handheld, whole-body ultrasound device built on its patented Ultrasound-on-Chip semiconductor technology. The company positioned it as a portable alternative for traditional cart-based ultrasound hardware.
What was right
-
Real, growing commercial revenue. The company reported $46.3 million in revenue for 2020 and guided to $60–62 million for 2021. So, they presented an already-selling product instead of a projection built on hope.
-
Credible, high-profile backers. Previous investors included the Bill & Melinda Gates Foundation, Fidelity, Baillie Gifford, and Fosun Industrial. These names signaled the diligence had already happened before the deck reached public markets.
-
Defensible technology tied to a concrete mission. The deck framed a specific access gap: 4.7 billion people worldwide without access to ultrasound.
What could be better
-
Cash burn that dwarfed the revenue base. R&D spend alone ran at 108–121% of revenue. The company also guided to a full-year net loss of $225–245 million for 2021. It was a spending scale that was hard to square with the size of the existing business.
-
One hardware category carried the entire pitch. With most of the story built around a single device, the deck left an open question: how the company would expand its addressable market before larger, better-funded players moved into handheld ultrasound too.
None of these four examples is a template to copy wholesale. But together they point to one rule: investors forgive an early-stage story that's honest about what's still unproven. They don't forgive a gap between what's claimed and what's actually shown.
How to visualize complex biotech science clearly
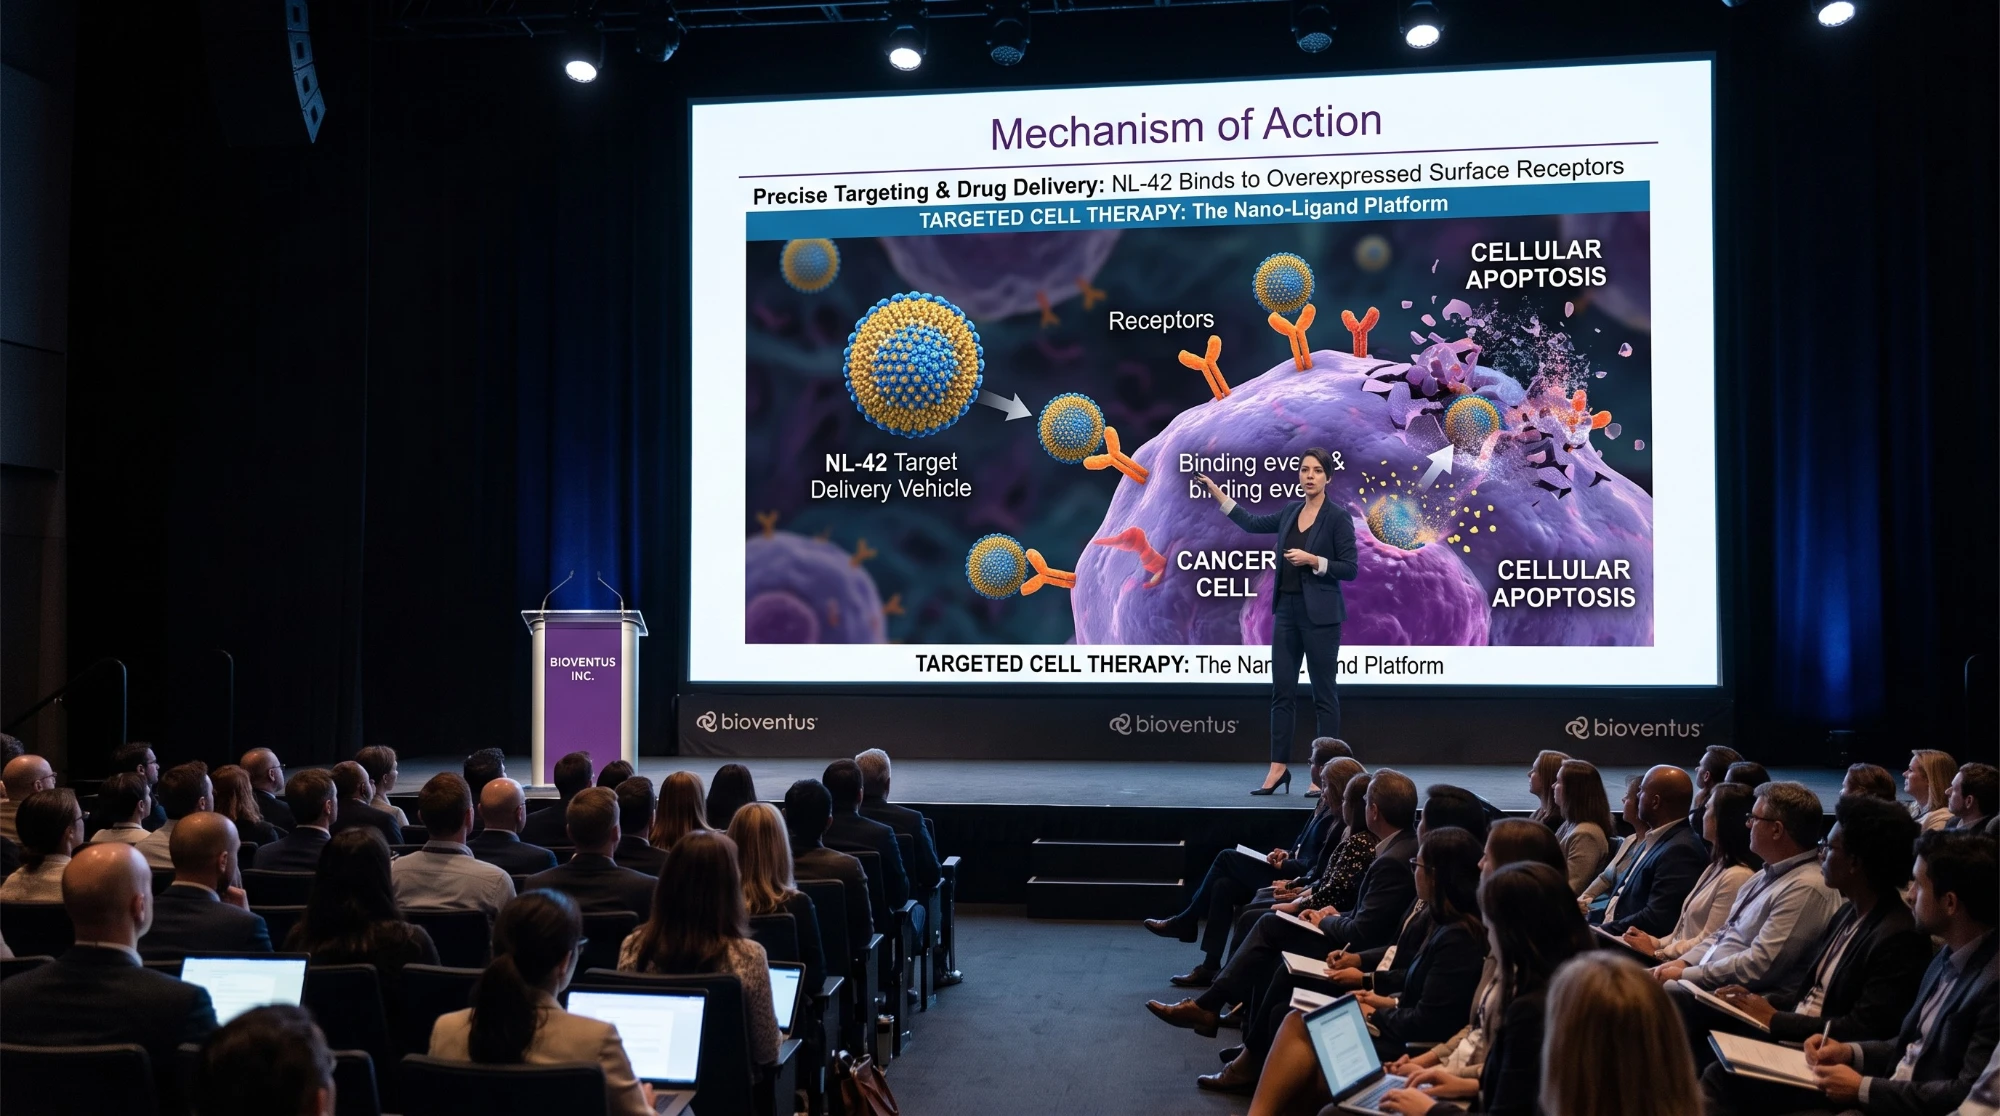
Not every biotech pitch deck slide needs a custom visual. The goal is always clarity, not spectacle. The wrong visual can slow a reader down as much as no visual. Here's a simple way to decide what to use and where:
-
Diagrams. Best for pathways, platform architecture, and short processes. Use these to show relationships between steps.
-
Scientific illustrations. Best for showcasing disease context, anatomy, experimental setup, or any mechanism that works fine as a single static image.
-
Still 3D visual. For a product, device, molecule, or any spatial relationship that's easier to grasp as a picture than as text.
-
Animation. For a mechanism of action, a cellular process, or any sequence that can't be shown clearly in one frame. This is where a short biotechnology animation earns its place, but only when the underlying process is actually sequential.
-
Charts. Best for presenting quantitative evidence, comparisons, and study results. If you have enough meaningful data to compare, a chart can communicate it more clearly than a text paragraph.
One distinction matters more than any of the above: live presentations and read-ahead PDFs are different documents. Animation can work great in a live pitch, but a deck that only makes sense with a voiceover fails the moment it's forwarded to a partner who wasn't in the room. Keep a static version of every animated moment. For instance, a key frame, a caption, or a simplified diagram can tell the full story on their own on the read-ahead deck.
And don't reach for 3D just because it's available. If a simple chart or diagram makes the point faster, use that instead. The best visuals in a biotech pitch deck are the ones a reader doesn't have to think about. They only make the science understandable.
“A lot of clients start by asking for a 3D video because it seems more advanced. But you only require animation if the story actually needs it. Some mechanisms just need a simple 3D model or render. The format should follow the science you present, not the other way around.”

The same clarity principles apply beyond the pitch deck. Molecular, cellular, and other scientific content required in publications, investor relations pages, and conference booths should be clear, precise, and help in grasping the key idea. If you want a deeper look at how visual storytelling affects fundraising outcomes, see how medical animation helps you raise pharma investment.
Common biotech pitch deck mistakes
A few mistakes show up across almost every weak biotech pitch deck:
-
Treating the deck like a scientific conference presentation instead of an investment case.
-
Blurring the line between observed data and interpretation.
-
Never connecting the funding ask to a specific de-risking milestone.
-
Leaving the company's actual scope, whether it is a single asset, pipeline, or platform, unclear.
-
Adding visuals that add complexity instead of removing it.
Most of these trace back to the same root cause, and to the same set of biotech pitch deck best practices. Write for the investor who needs to be convinced, not for a colleague who already understands the science.
Conclusion
A strong biotech pitch deck does three things at once: it proves the science holds up, states a real commercial case, and ties the funding to a milestone that actually reduces risk. Miss any one of those, and even excellent science struggles to get funded.
A clear deck structure gets you most of the way there. The rest comes down to how clearly you communicate the science itself, especially the parts that happen at a scale investors can't see.
If your mechanism, platform, or clinical data needs a visualization for precise demonstration, VOKA can help. We create MoA, product, and scientific visuals that make complex biology easier to understand, including for investor and fundraising materials.
FAQ
1. How many slides should a biotech pitch deck have?
There's no universal number. What matters is that the main deck stays short enough for a fast read. Usually, it is somewhere between 15 and 25 pages. Don't force a fixed slide count in your biotech story. Only the stage and complexity of your science are vital.
2. How should a biotech pitch deck change by funding stage?
At pre-seed and seed, investors are dealing with the hypothesis. So, you prioritize early validation data and the scientific rationale. By Series A and beyond, expectations shift toward stronger evidence, regulatory progress, partnerships, a defined pipeline, and milestone-based economics. The core slide structure stays similar. What changes is how much proof backs each slide.
3. Should a biotech pitch deck work without a presenter?
Yes. The read-ahead version needs to stand on its own. It means that the key claims, evidence, and next steps shouldn't depend on a voiceover to make sense. Your live version can lean more on visuals and pacing, but if a partner forwards your deck internally, it still has to make the case for you.
4. What belongs in the main deck versus the appendix?
The main deck should carry your investment thesis, essential evidence, development logic, market framing, team, and ask. Study-level detail, additional datasets, deeper analysis, risk scenarios, and likely due diligence questions belong in the appendix. They have to be prepared for a case when an investor wants to go further.
5. How much scientific detail should a biotech pitch deck include?
Keep the main deck to the level of detail that lets a reader understand your evidence, your differentiation, and what's still unproven. Methods, secondary datasets, and technical validation belong in the appendix. Simplify the language and always keep proven results and assumptions clearly separated.
Make VOKA your preferred source
See more VOKA articles in Google Search

Share
Table of contents
Thank you for your comment!
Your comment has been submitted for moderation and will be published soon. We'll email you once it’s live.